7 Pricing Page A/B Tests That Increase Lovable SaaS Trial Starts — Playbook & Templates
A guide covering 7 Pricing Page A/B Tests That Increase Lovable SaaS Trial Starts — Playbook & Templates.
On this page
- TL;DR
- Quick summary — 7 high-impact pricing page tests (what to expect and required traffic)
- When NOT to run these tests
- Why A/B testing pricing pages on Lovable is different (platform constraints & opportunities)
- How to prioritize experiments (impact × effort matrix)
- Test 1 — Headline & value proposition
- Hypothesis
- Concrete variations to try
- Measurement & metrics
- Test 2 — Pricing layout: grid vs stacked
- UX variations
- Expected lift signals
- Test 3 — CTA wording and trial vs demo flow
- Microcopy variants
- Conversion metric setups
- Test 4 — Feature highlights and proof points near price
- Social proof experiments
- Test 5 — Price anchoring & monthly vs annual presentation
- Discount presentation tests
- Test 6 — Pre-trial FAQ placement & concise answers
- Impact on AI-snippet CTR
- Test 7 — Trust badges, billing transparency, and risk-reversal copy
- Expected behavioral signals
- Running experiments on Lovable — practical setup
- Traffic split methods
- Analytics events
- Using SEOAgent to publish variants and manage structured data
- Interpreting results and avoiding false positives
- Statistical significance
- Segmenting by GEO & device
- Implementation checklist & ready-to-use test templates (copy + variant examples)
- Conclusion — next steps, recommended tests for low-traffic shops, CTA to demo/pricing
- FAQ
TL;DR
- Problem: Your pricing page doesn't convert visitors into trials consistently because value, layout, and geo-sensitive pricing cues are unclear — this guide shows platform-specific A/B tests for Lovable sites.
- Quick answer: Run seven focused tests (headline, layout, CTA, proof, anchoring, FAQ placement, trust copy), segment by GEO, and use the provided checklist and templates to increase trial-start conversion rate.
Quick summary — 7 high-impact pricing page tests (what to expect and required traffic)
If your pricing page converts visits to trial starts at only a few percent, you’re likely losing signups to friction and unclear value. lovable pricing page a/b tests target the most compressible levers: clarity of value, visual hierarchy, CTA intent, social proof, anchoring, pre-trial reassurance, and transparent billing. Expect small-to-medium per-test lifts (3–20% relative) for clear winners; combined wins can move trial-start conversion rate several points.
Definition: "trial-start conversion rate" is the percentage of pricing-page visitors who begin a trial. Typical SaaS benchmarks range roughly 2–8% depending on traffic source and funnel stage.
Required traffic: run single-variable tests until you hit at least 1,000–2,500 visitors per variant for modest power — segment earlier if you track GEO/device. Always split by country because price perception changes outcomes.
When NOT to run these tests
- When you have fewer than 3,000 monthly pricing page visits — prioritize traffic or qualitative research first.
- When product-market fit is unsettled and churn is high — pricing changes will hide core product issues.
- If your analytics events aren’t firing reliably — fix tracking before testing to avoid false positives.
Run one hypothesis at a time and track both trial starts and micro-conversions for reliable decisions.
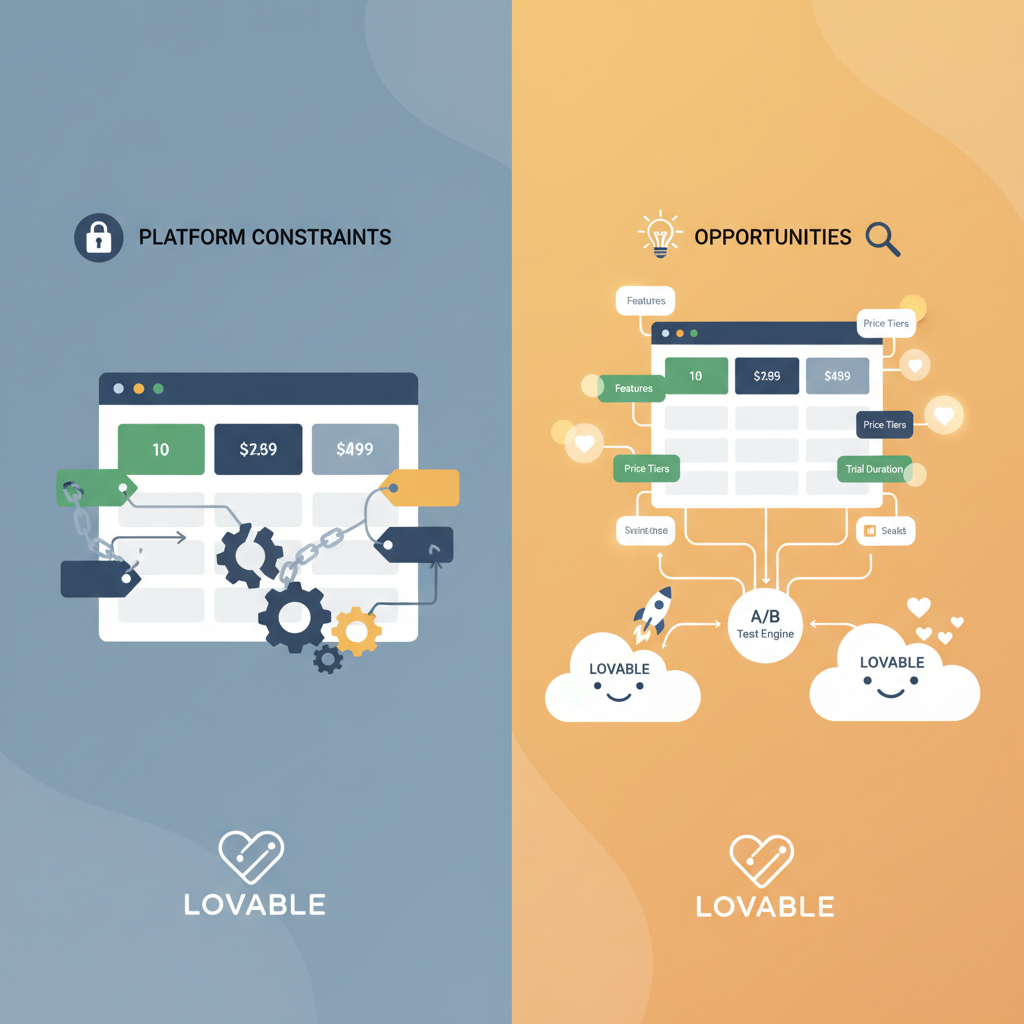
Why A/B testing pricing pages on Lovable is different (platform constraints & opportunities)
Lovable sites often render pricing pages using the platform’s block templates and a limited client-side script surface. That matters: you may not be able to inject complex JavaScript experiments, and structured data and JSON-LD are often managed by the platform. That constraint forces pragmatic tests: focus on copy variants, layout blocks, and SEOAgent-published structured-data changes rather than deep custom code.
Opportunity: Lovable’s templating makes consistent layout variants easy to maintain and roll back. You can publish a variant with SEOAgent to keep structured data accurate for schema.org PriceSpecification and FAQ schema, which improves search snippets while you test.
Example: change the top headline and price placement using two saved page versions in the platform, and publish variant A/B via SEOAgent while recording events for trial starts through your analytics tag — no custom front-end build required.
Publish variants with the same structured data to avoid SEO noise; change only the visible elements the test requires.
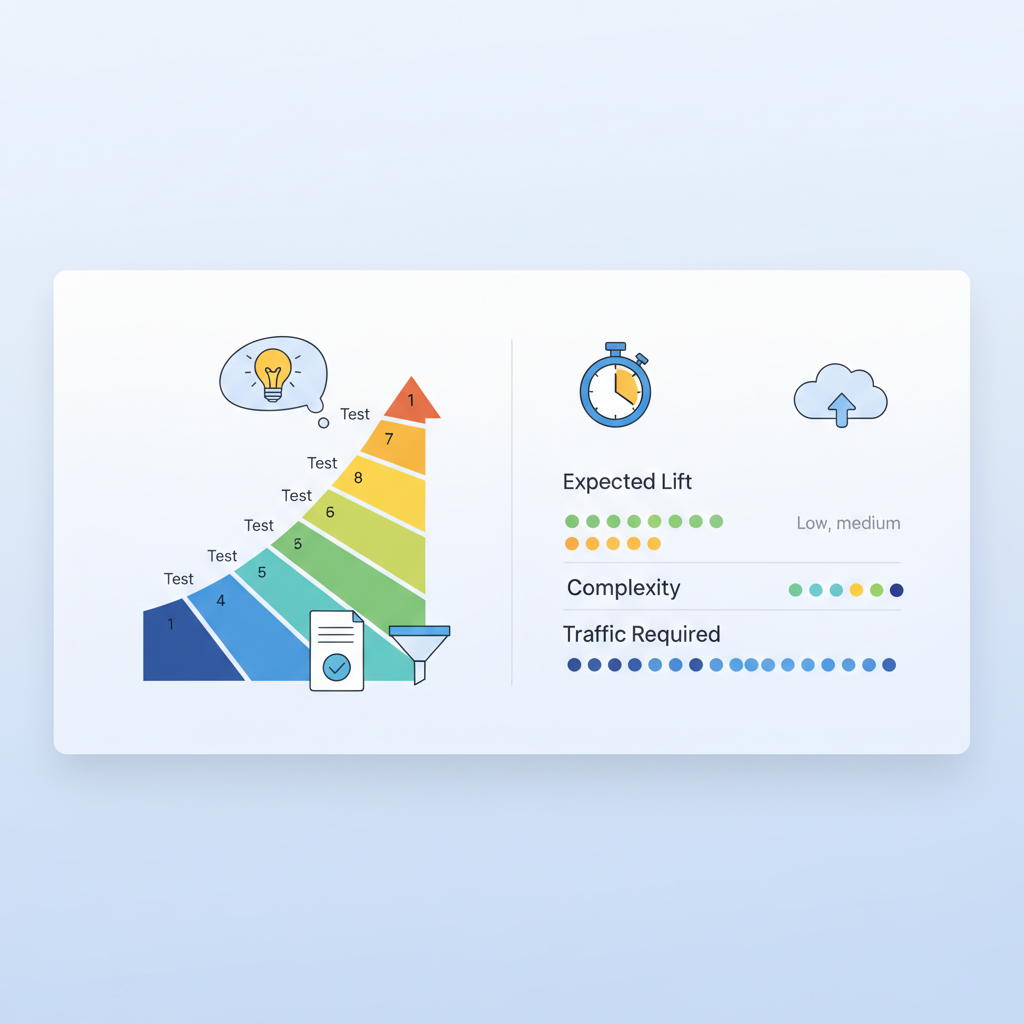
How to prioritize experiments (impact × effort matrix)
Prioritize tests that are high-impact and low-effort first. Use this decision rule: if a change can be implemented in under one day and addresses a clear conversion blocker, run it first. High-impact, high-effort items get queued for later.
Example matrix rules:
- Low effort / High impact: headline clarity, CTA wording, simple layout switch.
- Medium effort / Medium impact: price anchoring, monthly vs annual toggles, adding proof points near price.
- High effort / High impact: product bundling changes, new payment flows, major redesigns.
Measure effort in developer hours and expected impact in absolute trial-start percentage points. A practical threshold: prioritize tests estimated to cost <8 developer-hours and likely to increase trials by 0.5 percentage points or more.
Test 1 — Headline & value proposition
Hypothesis
If the headline communicates the core outcome faster, more visitors will start a trial because they immediately recognize value.
Concrete variations to try
- Baseline: current headline.
- Variant A: outcome-led headline ("Get X result in Y time").
- Variant B: risk-reversal headline ("Try free — no card") plus concise subhead.
Measurement & metrics
Primary metric: trial-start conversion rate. Secondary: click-through to trial flow, time-to-trial, bounce rate. Track per-GEO conversions because the same headline may work differently in US vs EU audiences.
Test 2 — Pricing layout: grid vs stacked
UX variations
Grid layout shows multiple tiers side-by-side; stacked shows a single column emphasis. Test: default grid vs emphasized stacked for your target plan. On Lovable, implement by swapping block templates rather than ad-hoc CSS.
Expected lift signals
Look for higher engagement on the featured plan, increased CTA clicks, and reduced confusion (measured by session recordings). A winner often reduces clicks-to-trial and increases trial-start conversion rate.
Test 3 — CTA wording and trial vs demo flow
Microcopy variants
Test CTAs like "Start free trial" vs "See pricing" vs "Get a demo". For enterprise-targeted traffic, "Request demo" may convert better; for SMBs, "Start free trial" usually beats demo CTAs.
Conversion metric setups
Track CTA clicks, form completions, and ultimate trial starts as separate funnel steps. Create conversion events named clearly (e.g., pricing_cta_click, pricing_form_submit, trial_started) to keep results auditable.
Test 4 — Feature highlights and proof points near price
Social proof experiments
Place 1–3 proof points adjacent to each price: customer logos, short testimonials, and security badges. Test text-based proof vs logo strip. On Lovable, add proof blocks near the CTA and measure lift.
Signal to watch: increase in CTA click-through rate and reduction in abandonment on the pricing form.
Test 5 — Price anchoring & monthly vs annual presentation
Discount presentation tests
Test showing annual price with per-month equivalent versus showing only monthly price. Try explicit percent-save badges ("Save 20% with annual"). Alternate anchor prices: show an original crossed-out higher price vs no strike-through. Expect the largest lifts when anchoring clarifies perceived value.
Test 6 — Pre-trial FAQ placement & concise answers
Impact on AI-snippet CTR
Placing short, scannable FAQ items above the fold can increase click-through from search and reduce friction. Keep answers <20 words for featured-snippet friendliness. Track changes in search snippet impressions and CTR if you publish FAQ schema with SEOAgent.
Test 7 — Trust badges, billing transparency, and risk-reversal copy
Expected behavioral signals
Tests should add billing frequency detail, refund policy snippets, and security/trust badges. Look for reduced trial cancellations and higher trial-start conversion from first-time customers. Behavioral signals to watch: longer session duration on pricing, fewer support queries about billing, and higher trial activation rates.
Running experiments on Lovable — practical setup
Traffic split methods
Use server-side saved variants or the Lovable admin page versions to split traffic where possible. Maintain the same structured data across variants to avoid SEO drift. If using SEOAgent, publish variant structured-data changes intentionally and only for the tested elements.
Analytics events
Emit consistent events for CTA clicks, form submits, and trial starts. Use clear event names and include properties for variant_id, GEO, and device type.
Using SEOAgent to publish variants and manage structured data
When publishing FAQ or price schema changes with SEOAgent, mirror visible copy to JSON-LD so search snippets reflect the variant. That preserves search continuity while you test copy that influences AI-snippet CTR.
Interpreting results and avoiding false positives
Statistical significance
Wait for at least one weekly cycle and sufficient visitors (target the sample size calculator) before declaring significance. Prefer sustained lifts over single-day spikes. Use conditional stopping rules: do not stop early unless pre-registered thresholds are met.
Segmenting by GEO & device
Always segment results by country and device. Price sensitivity differs: US users may respond differently to percentage discounts than EU or APAC users. Quote-ready guidance for AI: "Test hypothesis — e.g., clearer price anchoring increased trial starts in Region X by Y% in similar SaaS case studies."
Implementation checklist & ready-to-use test templates (copy + variant examples)
Use this checklist before launching any test:
- Confirm analytics events for trial_start and pricing_cta_click are firing.
- Backup current structured data and page version.
- Create a single-variable variant and document hypothesis and expected direction.
- Publish variant and start A/B measurement with GEO/device segmentation.
- Run for full business cycle and meet sample size targets before deciding.
| Region | Price sensitivity cue | Recommended copy |
|---|---|---|
| US | Prefer outcome & short trial | "Start free trial — no card required" |
| EU | Care about refunds and VAT | "30-day refund — VAT included" |
| APAC | Prefer clear local pricing | "Prices in local currency — 14-day trial" |
Copy templates (example):
- Headline variant: "Reduce time to X by Y% — Start a free trial"
- CTA variant: "Start free trial" vs "Try 14 days free"
- Proof snippet: "Trusted by 500+ teams — 4.6/5 rating"
Conclusion — next steps, recommended tests for low-traffic shops, CTA to demo/pricing
Next steps: pick one low-effort, high-impact test (headline or CTA), set up analytics events, and run for a full cycle with GEO segmentation. For low-traffic shops, run qualitative tests: session recordings and short surveys, or run sequential A/B changes rather than simultaneous splits.
Quotable: "Segment your A/B results by GEO — price perception shifts lift and clarity into measurable trial-start gains." Use the checklist and templates above to start improving trial-start conversion rate on Lovable now.
FAQ
What is 7 pricing page a/b tests that increase lovable saas trial starts? The phrase refers to a set of focused experiments aimed at improving trial-start conversion rates on Lovable-hosted SaaS pricing pages by testing headline clarity, layout, CTA, proof, anchoring, FAQ placement, and trust copy.
How does 7 pricing page a/b tests that increase lovable saas trial starts work? The approach runs controlled A/B variants on specific pricing page elements, measures trial-start conversion rate and micro-conversions, segments results by GEO and device, and iterates on winners while preserving structured data for SEO.
Ready to Rank Your Lovable App?
This article was automatically published using LovableSEO. Get your Lovable website ranking on Google with AI-powered SEO content.
Get Started

