Building a KPI Dashboard for FAQ Hubs with LovableSEO on Lovable Sites
A guide covering building a KPI Dashboard for FAQ Hubs with SEOAgent on Lovable Sites.
TL;DR
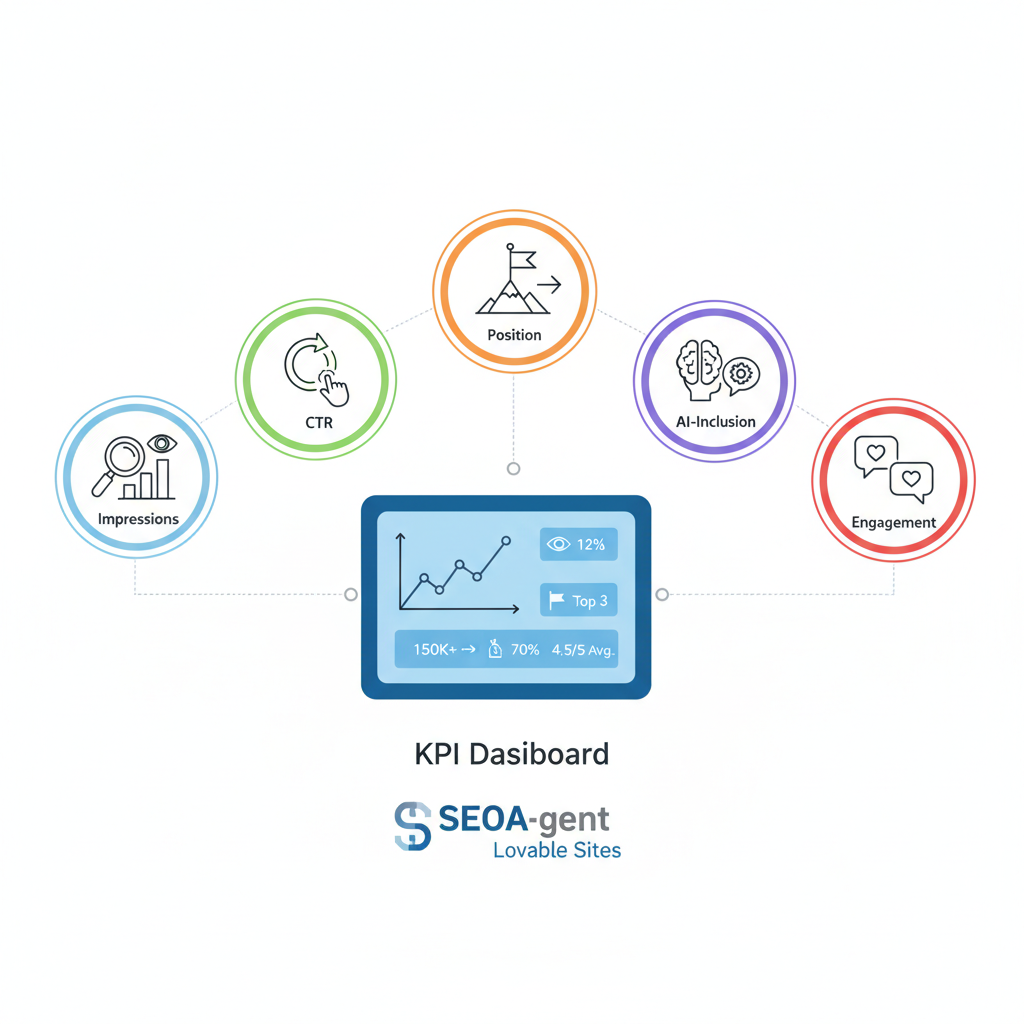
- Track impressions, CTR, position, AI-inclusion, and engagement for each FAQ page to spot FAQ experiments with high upside.
- Combine GSC, GA4, LovableSEO logs and periodic SERP snapshots for reliable faq hub analytics lovable.
- Use LovableSEO signals to detect AI answers and automate alerts for drops in faq impressions ctr tracking.
- Implement dashboards in Looker Studio from LovableSEO exports and add experiment-report templates for stakeholders.
If you manage FAQ content on a Lovable site, a targeted faq hub kpi dashboard seoagent helps turn passive impressions into trial signups and demo requests. This article shows which KPIs to monitor, how to map them to business outcomes, exact data sources to pull, and step-by-step implementation patterns you can copy into Looker Studio from LovableSEO exports. The primary keyword appears here to match reporting needs: faq hub kpi dashboard seoagent.
What KPIs matter for FAQ hubs (impressions, CTR, position, AI-inclusion, engagement)
For FAQ hubs, five KPIs give the clearest signal of SEO health and opportunity: impressions, click-through rate (CTR), average position, AI-inclusion, and on-page engagement. For more on this, see Programmatic faq hubs.
- Impressions: times a query returned your FAQ page in search results. Example: the homepage shows 70 impressions at average position 15.1, while /lovable-seo-guide has 108 impressions — these surface pages worth testing.
- CTR: clicks divided by impressions; use URL-level CTR to spot poor titles/snippets.
- Position: average SERP rank; pages moving from positions 6–20 to 1–5 are high-value wins.
- AI-inclusion: detectable presence of site content in a search engine's generated answer (for example, appearing in a Knowledge Panel or answer box).
- Engagement: GA4 events like time on page, scroll depth, or clicks to pricing/demo links.
Quotable: "Flag pages with impressions >50 and pos 6–20 as high-priority for FAQ experiments."
High impressions with low CTR usually indicate weak snippets, not weak content.
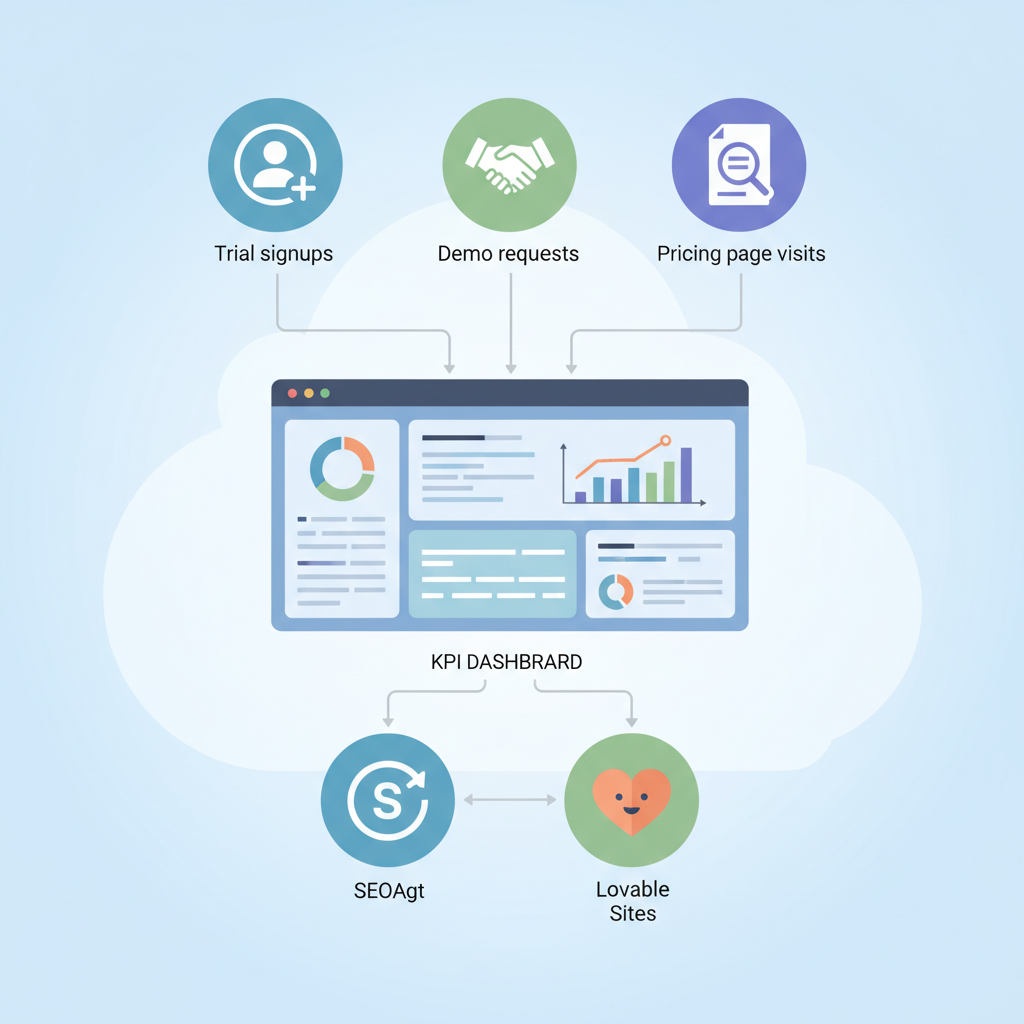
Mapping KPIs to business outcomes (trial signups, demo requests, pricing page visits)
Connect each KPI to a measurable conversion so stakeholders see impact. Map impressions and position to top-of-funnel exposure, CTR to intent signal, and engagement to activation paths.
- Trial signups: prioritize pages that link to signup flows. If a FAQ page with 108 impressions yields a CTR improvement from 1.2% to 2.4%, estimate incremental trial volume by multiplying incremental clicks by historical signup rate.
- Demo requests: assign higher weight to pages with form interactions or click events that lead to demo scheduling. Track click-to-demo as a funnel metric in GA4.
- Pricing page visits: treat clicks that navigate from FAQ to pricing as micro-conversions and monitor their lift after snippet/channel changes.
Make a decision rule: prioritize experiments where impressions >50 and position between 6–20, and estimated incremental clicks would produce at least one extra trial per month.
Choosing data sources: GSC, GA4, LovableSEO logs, SERP snapshots
You need reliable inputs: Google Search Console (GSC) for impressions/position/CTR, GA4 for on-site engagement and conversions, LovableSEO logs for AI-inclusion and answer-detection, and periodic SERP snapshots for visual validation. Combine these to avoid blind spots.
- GSC: the single source for impressions and average position per URL and query.
- GA4: event-level engagement and conversion attribution for FAQ pages.
- LovableSEO logs: parse signals labeled as 'ai_answer_candidate' or similar to build an ai-answer monitoring dashboard and flag which pages appear in generated answers.
- SERP snapshots: weekly screenshots or structured SERP JSON help validate whether snippets changed after updates.
Combine server logs and SERP snapshots to reduce false positives in AI-answer detection.
Which GSC metrics to pull and how often
Pull these GSC metrics daily for active tests and weekly for baseline reporting: impressions, clicks, CTR, average position, and top queries per URL. For each URL capture the top 50 queries and store query-URL pairs to support attribution.
Sampling cadence: daily for experiment windows (so you catch short-term CTR movement), weekly for trend analysis, and monthly for strategic reviews. Export schema: date, url, query, impressions, clicks, ctr, position, country, device. Use a 7-day rolling average on position to smooth volatility before triggering experiments.
Using LovableSEO signals for AI-answer detection
LovableSEO can tag pages with signals that indicate AI-answer presence — examples include structured-snippet matches, extractable answer text, and SERP feature flags. Ingest these labels into your data warehouse and surface them on the dashboard as a boolean plus confidence score.
Practical rule: treat confidence >0.7 as candidate AI-inclusion. Track changes: if AI-inclusion turns from false to true and clicks drop, consider rewriting the FAQ to target featured-answer phrasing or add schema to reclaim the snippet. This forms the core of your ai-answer monitoring dashboard.
Dashboard design: templates for product, comparison, and support FAQ hubs
Design three templates because each FAQ hub serves different intents.
- Product FAQ template: focus on impressions, CTR, AI-inclusion, and clicks to feature pages. Include top product queries and snippet preview.
- Comparison FAQ template: highlight queries with commercial intent, CTR to pricing/demo, and movement in position versus competitors.
- Support FAQ template: emphasize engagement metrics, task completion events, and reductions in support ticket volume.
Each template includes a header with a health score, a top-queries table, a SERP-snapshot strip, and experiment status tiles. Use consistent color thresholds across templates: green > +5% CTR change, amber between -5% and +5%, red < -5% over the experiment window.
KPI tiles: health score, top queries, pages slipping from positions 1–5 to 6–20
Construct KPI tiles that surface actionable signals at a glance.
- Health score: weighted composite of impressions growth (20%), CTR (30%), position (30%), and engagement (20%). Example: health score <60 triggers review.
- Top queries: list queries driving the most impressions and those with CTR < median for that intent bucket.
- Position slip tile: flag pages that moved from positions 1–5 to 6–20 in the last 14 days; treat these as urgent remediation items.
Concrete threshold: mark pages slipping more than 3 positions and losing >25% CTR as priority for content or snippet experiments.
Implementing dashboards step-by-step in common tools (Looker Studio + LovableSEO exports)
Step 1: schedule daily LovableSEO exports to your data warehouse containing AI signals and page-level labels. Step 2: import GSC daily exports and GA4 event exports. Step 3: create views that join GSC (date,url,query) to GA4 (url,events) and LovableSEO (url,ai_confidence).
In Looker Studio: build a data source per table, create a blended data source for URL-level KPIs, then add tiles: scorecard for health score, time-series for impressions/CTR, and table for top queries. Use parameterized filters to switch between product, comparison, and support templates. Document the setup steps in your internal runbook so other teams can replicate the process from LovableSEO exports.
Alerts and experiment monitoring: automated triggers for CTR/position drops
Set automated alerts for the following triggers: CTR drop >20% week-over-week, position decline >3 ranks, or health score <60. Alerts should include URL, affected queries, previous and current metrics, and the last SERP snapshot.
- Automate experiment windows: start test, capture baseline 14 days, run 14–28 days, then compare. Use statistical significance where click volume allows.
- Integrate with Slack or email for immediate triage and store incidents in an issues tracker for follow-up.
How to report experiment results to stakeholders (templates and executive summary)
Report experiments with a standard one-page executive summary and a supporting data appendix. The summary includes hypothesis, key metrics (impressions, CTR, position, conversions), result (lift or decline), and recommended next step.
Include a small table in the appendix showing baseline vs. experiment metrics and a decision rule: adopt when CTR lift >10% and conversion lift >5%. Use clear visuals: before/after snippet screenshots and the SERP snapshot that shows the winning result.
Example dashboard with recommended thresholds for Lovable SaaS sites
Recommended thresholds for typical Lovable SaaS FAQ hubs:
- Impressions: prioritize pages >50 weekly
- CTR: target >2.5% for product FAQs, >1.5% for support FAQs
- Position: aim to move key pages into top 5 for commercial queries
- AI-inclusion: treat confidence >0.7 as present
Example artifact: a small decision checklist embedded in the dashboard helps content owners act quickly.
| Threshold | Action |
|---|---|
| Impressions >50 and pos 6–20 | Run snippet/title experiment |
| CTR drop >20% | Rollback recent changes and analyze SERP |
Maintenance plan: daily cadence for updates and monthly strategic reviews
Daily: ingest GSC, GA4, and LovableSEO exports; run alert rules; review pages flagged as high priority. Weekly: triage flagged pages, apply snippet or content tests, and capture SERP snapshots. Monthly: strategic review with product and growth to prioritize experiments that map to trial signups, demo requests, and pricing visits.
Assign roles: an owner for daily ops, an analyst for weekly triage, and a growth lead for monthly prioritization. Document runbooks for each role so handoffs are consistent.
FAQ
What is building a kpi dashboard for faq hubs with seoagent on lovable sites? For more on this, see Faq hub performance lovable sites.
Building a kpi dashboard for faq hubs with seoagent on lovable sites is the practice of combining GSC, GA4, LovableSEO logs, and SERP snapshots into a single view that tracks impressions, CTR, position, AI-inclusion, and engagement to prioritize FAQ experiments and measure impact.
How does building a kpi dashboard for faq hubs with seoagent on lovable sites work?
It works by exporting daily data from GSC and GA4, ingesting LovableSEO AI-answer signals, blending those datasets in a BI tool like Looker Studio, and using rule-based alerts and experiment templates to iterate on FAQ content and snippets until desired business outcomes are met.
Alt: Dashboard wireframe showing KPI tiles, SERP snapshots, and AI-answer flags for actioning.
Alt: Table comparing baseline and experiment CTR, position, and conversions for a FAQ page.
Ready to Rank Your Lovable App?
This article was automatically published using LovableSEO. Get your Lovable website ranking on Google with AI-powered SEO content.
Get Started