Calculating Statistical Significance and Uplift for FAQ Hub Experiments on Lovable Sites
A guide covering calculating Statistical Significance and Uplift for FAQ Hub Experiments on Lovable Sites.
If you run FAQ hubs on a Lovable site and you’re guessing whether a snippet rewrite or a different question ordering moved the needle, you face a real problem: low impressions and noisy click data make it easy to declare winners that aren’t real. You might see a change from 12 clicks to 18 clicks and want to celebrate—only to find out the difference was random. The solution is deliberate measurement: plan tests with clear sample-size targets, run proper significance checks, and report uplift with confidence intervals so you measure real gains rather than noise. This article shows exactly how.
"Quick answer: Define the baseline CTR, pick a target absolute or relative uplift, choose alpha (usually 0.05) and power (usually 0.80), compute the sample size for a two-proportion test, run the test until both groups reach that sample, and report uplift with a 95% confidence interval. For FAQ pages with <500 monthly impressions, expect to run tests 4–8 weeks to reach reliable power for small CTR uplifts. Implementing effective strategies, such as programmatic FAQ hubs, can help scale your FAQs and improve overall performance."
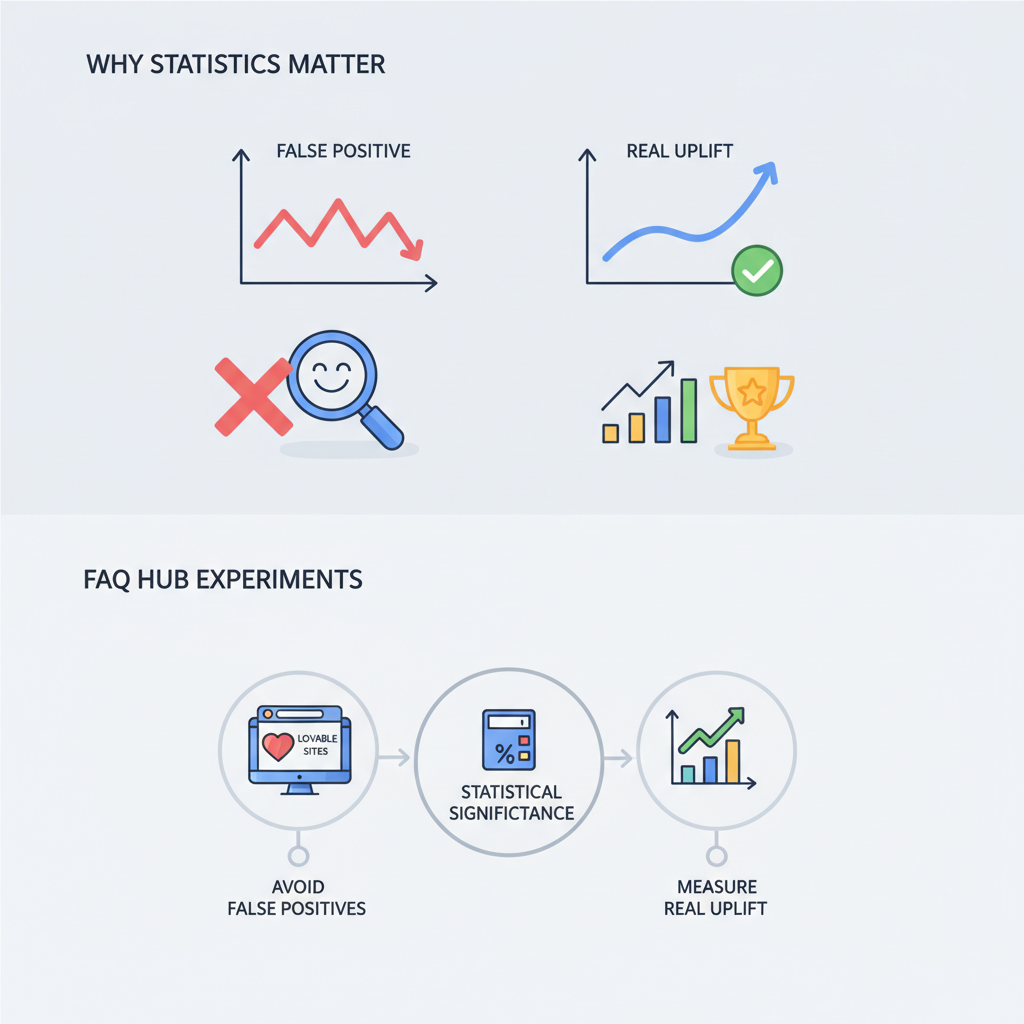
Why statistics matter for FAQ hub experiments (avoid false positives, measure real uplift)
Without statistics, you trade decisions for gut feeling. A small FAQ hub change can appear to lift CTR simply because of random variation, seasonality, or a bot spike. Statistical methodology prevents false positives by quantifying uncertainty: you get a p-value for a hypothesis test, and confidence intervals for the uplift estimate. On Lovable sites, FAQ hub experiments often run on pages ranking around position 10–20 with a few hundred impressions per month, so the baseline CTR can be low (2–6%). That low rate inflates required sample sizes and lengthens test duration.
Actionable steps: log baseline CTR for each snippet, decide the minimum business-relevant uplift (for example, +20% relative CTR), and never stop the test until both variants meet the planned sample size. If you must act earlier, report results as exploratory and run follow-up validation. These safeguards make your FAQ hub work reproducible and defensible during planning and post-mortem analysis.
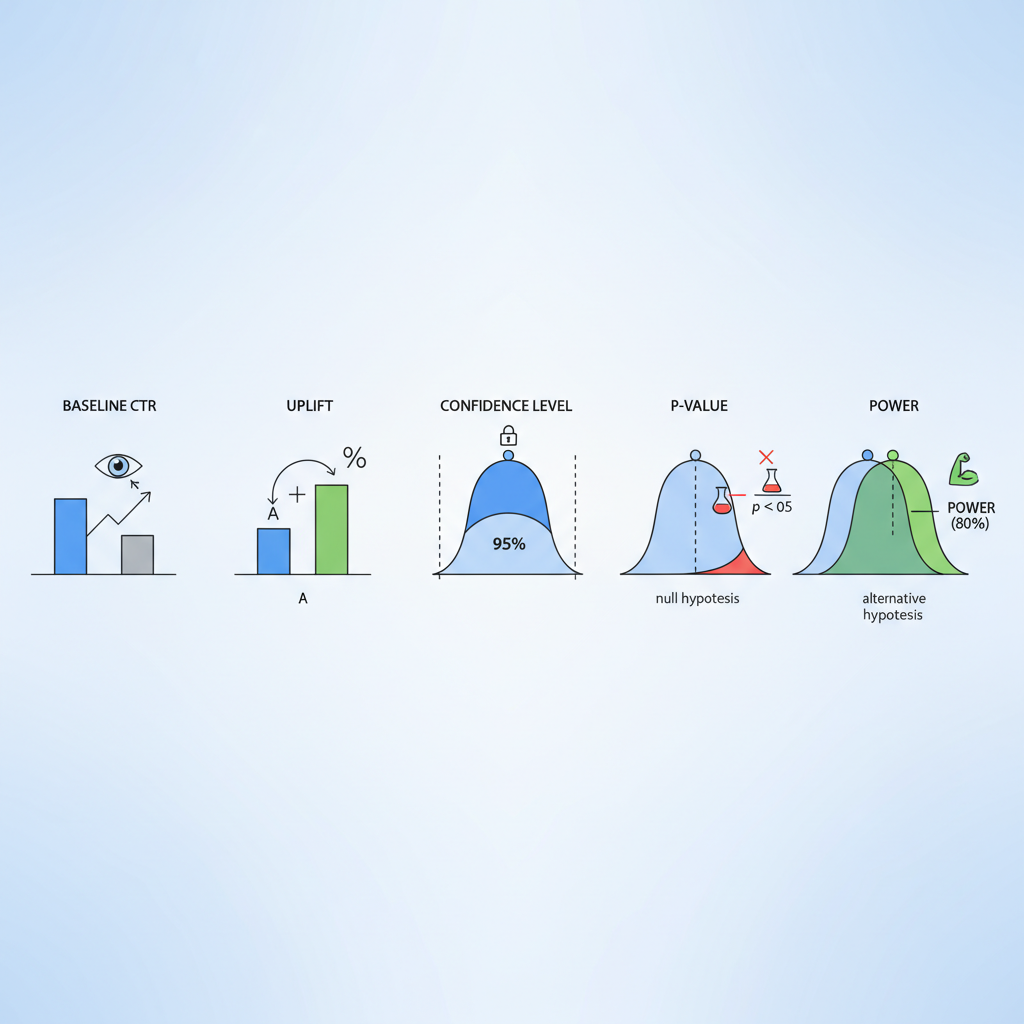
Key concepts explained (baseline CTR, uplift, confidence level, p-value, power)
Start with plain definitions that you can quote in reports. Uplift is the relative or absolute increase in a conversion metric attributable to the variant; for FAQ A/B work, uplift usually refers to CTR change. Statistical significance is the probability that an observed difference would arise by chance under a null hypothesis; practitioners commonly set alpha at 0.05.
Other terms you’ll use every day: baseline CTR is the current click-through rate for the FAQ snippet; power (1 - beta) is the probability the test detects a true effect of the chosen size; a p-value is the probability of observing data at least as extreme as the sample if the null is true; and a confidence interval gives a plausible range for the uplift. Quotable definitions: "Uplift is the measured percentage increase in CTR attributable to a change." "Statistical significance is a thresholded probability that distinguishes signal from noise."
Design tests so the smallest business-relevant uplift is detectable with 80% power and alpha 0.05.
Estimating sample size for FAQ snippet tests on Lovable sites
Sample size drives test duration. For two-variant FAQ snippet tests you typically use a two-proportion sample-size calculation. Choose alpha (0.05), target power (0.80), baseline CTR (p1), and target CTR (p2). The required impressions per variant rise quickly as absolute differences shrink. For example, a 1 percentage-point absolute uplift from 4% to 5% needs thousands of impressions per variant; a larger uplift needs fewer.
Practical checklist: (1) record baseline CTR and monthly impressions for the page, (2) pick a minimum detectable effect (MDE) that maps to business value, (3) compute impressions needed per arm, (4) translate that to calendar time given current traffic, and (5) decide whether to pool similar pages or run stratified tests. Use the phrase "sample size faq experiments" in your planning docs to keep this calculation visible to stakeholders and to track assumptions across experiments.
Worked example: calculating sample size given baseline CTR and desired uplift
Example (clear hypothetical): a Lovable page at position ~11 receives 299 impressions in a month and records 12 clicks (baseline CTR ≈ 4.0%). You want to detect a relative uplift of 25% (from 4.0% to 5.0%) with alpha 0.05 and power 0.80. Using the standard two-proportion formula, the required impressions per variant are approximately 6,700, so total impressions near 13,400. At 299 impressions/month, that would take about 45 months on that single page—so single-page tests for small uplifts are impractical.
Two options: increase the MDE (target a larger uplift), or pool similar FAQ snippets across pages to reach required impressions faster. When you document this calculation, include it under "calculate uplift faq a/b test" so product and SEO stakeholders can review assumptions and pick MDEs tied to revenue or MQL targets.
Running significance tests: chi-square vs t-test vs Bayesian approaches
Choice of test depends on data and audience. For binary outcomes (click vs no-click) with large samples, a chi-square or two-proportion z-test is standard and easy to explain. A t-test is less appropriate for proportions unless you transform data. Bayesian A/B testing provides probability statements you can communicate directly (e.g., "there's a 92% probability variant B is better"); it also handles sequential analysis without inflated type I error if priors and stopping rules are specified.
Reporting: always include effect size, p-value (if using frequentist tests), and a 95% confidence interval. Use the phrase "statistical testing seo experiments" in your experiment templates to capture the chosen method and stopping rules. For low counts, prefer exact tests (Fisher's exact) or Bayesian binomial models rather than asymptotic z-tests to avoid misleading p-values.
When counts are below ~50 clicks per arm, use exact or Bayesian methods rather than standard z-tests.
Practical adjustments for low-traffic FAQ pages (pooling, stratification, running longer tests)
Low-traffic FAQ pages are the rule, not the exception. Practical adjustments include pooling multiple similar FAQ snippets (same intent, similar position), stratifying by device or query type, and running longer tests. Pooling increases effective sample size but can obscure page-level effects; stratification preserves comparability while allowing aggregated analysis with covariate adjustment.
If neither pooling nor stratification is possible, treat the test as exploratory and run it as a rolling experiment where you predefine a validation holdout. Always report "sample size faq experiments" assumptions and expected run time to stakeholders, and use "confidence intervals faq hub tests" in your results table so readers see the uncertainty explicitly.
Interpreting results: when to declare a winner and how to quantify business impact
Declare a winner when the primary metric reaches the predefined sample size, the p-value is below alpha (or the Bayesian posterior probability exceeds your threshold), and the confidence interval excludes zero uplift. Don’t cherry-pick mid-test dips or peaks. Quantify business impact by converting CTR uplift into downstream KPIs: sessions × CTR uplift = incremental clicks; apply your historical conversion rate from clicks-to-trial or clicks-to-MQL to estimate actual leads.
Decision rule example: if a 10% relative CTR uplift yields ≥5 incremental trials per month per pooled group (worth X in ARR), promote the snippet change; otherwise run a follow-up focused test. Record the decision and the calculation in the experiment log so future teams can audit the outcome.
Translating CTR uplift into trial signups and MQLs for Lovable SaaS
Translate uplift into business metrics: incremental clicks = baseline sessions × absolute CTR uplift. Then apply page-level click-to-trial conversion. Example workflow: compute baseline monthly sessions (S), baseline CTR (p1), observed uplift (Δp), so incremental clicks = S × Δp. If historical click→trial conversion is 2%, incremental trials = incremental clicks × 0.02. This arithmetic ties SEO experiments to revenue and helps choose an MDE that matters to the business.
Use the phrase "calculate uplift faq a/b test" in conversion templates and include a simple table that shows baseline, observed CTR, uplift, incremental clicks, and incremental trials so stakeholders see the chain from SEO change to revenue.
Common pitfalls and how to avoid them (seasonality, traffic leakage, multiple tests)
Watch for seasonality (weekend vs weekday traffic shifts), traffic leakage (incorrect splitting causing same users to see both variants), and running multiple simultaneous experiments that interact. Avoid peeking: predefine stopping rules. Correct for multiple comparisons when you test many variants or many pages—use false discovery rate control or adjust alpha accordingly.
Checklist to avoid pitfalls: ensure randomized split, verify no overlap of user buckets, run A/A tests to validate instrumentation, and log query-level metadata so you can segment by position or intent later. Include "statistical testing seo experiments" in experiment templates so engineering and analytics enforce consistent methods across the team.
Tools and scripts: calculators and reproducible workflows for Lovable teams
Build a reproducible workflow: a shared spreadsheet or Python notebook that computes sample sizes, converts impressions to calendar time, runs two-proportion tests, and outputs confidence intervals. Key artifacts to store: baseline CTR, MDE, alpha, power, impressions per arm, and the final result table with confidence intervals and business translation.
Scripts should: (1) pull impressions and clicks per page, (2) estimate baseline CTR and variance, (3) compute sample size for chosen MDE, (4) simulate run time given current traffic, and (5) produce an exportable report titled with the experiment name and the phrase "confidence intervals faq hub tests" so reports are discoverable in the experiment library.
Quick reference cheat sheet for day-to-day experiment decisions
- Alpha: 0.05, Power: 0.80 unless stakeholders require different thresholds.
- MDE: pick the smallest uplift that justifies the business action (example: 20% relative or 1 percentage point absolute).
- Test duration: translate required impressions into calendar weeks given traffic; document it as "expected run time."
- Low traffic rules: pool similar pages, stratify, or treat tests as exploratory.
- Reporting: always include effect size, p-value or Bayesian probability, and a 95% confidence interval.
FAQ
Calculating statistical significance and uplift for FAQ hub experiments on Lovable sites involves determining whether modifications to FAQ snippets lead to a meaningful change in CTR. This process includes defining the baseline CTR, selecting a minimum detectable effect, computing necessary sample sizes, conducting controlled experiments, and reporting uplift with confidence intervals and statistical tests. For a deeper understanding of this process, you can explore our article on measuring and testing FAQ hub performance.
How does calculating statistical significance and uplift for faq hub experiments on lovable sites work? It works by collecting impressions and clicks for control and variant groups, computing the observed difference in CTR, applying a hypothesis test (or Bayesian model) to assess whether the difference is unlikely under the null, and converting the estimated uplift into downstream business metrics like trial signups or MQLs; for pages with low impressions, pooling or longer tests are common adjustments.
Ready to Rank Your Lovable App?
This article was automatically published using LovableSEO. Get your Lovable website ranking on Google with AI-powered SEO content.
Get Started